CDS v2 benchmarks
Provenance
This table is a transcription of the committed machine-readable results in
benchmarks/results.json.
Do not edit the numbers by hand; regenerate them with
benchmarks/run_benchmarks.py.
The committed snapshot is generated, archived, and explicitly not current:
its _snapshot block names the generator, the commit and release it was
recorded from (is_current_release: false), and the commands that produce a
fresh one. It is not a claim about any current release: read it as "cds2 3.0.0
versus the baseline libraries on one machine".
| Field | Value |
|---|---|
| CDS2 version | 3.0.0 (not the current release) |
| Git commit | 6ea5a02 (= tag v3.0.0) |
| Run timestamp (UTC) | 2026-08-22T15:13:41 |
| Platform | Windows-11-10.0.26200-SP0, Intel64 Family 6 Model 170 Stepping 4 |
| Python | 3.12.10 |
| numpy / scipy / pandas | 2.4.0 / 1.17.0 / 3.0.3 |
| networkx / scikit-learn | 3.6.1 / 1.9.0 |
These timings predate the current release line and one contributor machine. They are engineering measurements, not universal performance claims. See Benchmark methodology before quoting any ratio.
Where fresh numbers come from
Nothing in this file is a live measurement. To produce current timings:
# provenance-rich run; writes results.json + provenance.json
python -m benchmarks.research_run --quick --core-only

# or the low-level suite directly
python -m benchmarks.run_benchmarks --quick --json benchmarks/artifacts/latest
Fresh output lands in benchmarks/artifacts/latest/, which is git-ignored:
only the archived snapshot above is committed. Updating the committed snapshot
is a deliberate, reviewable act — regenerate, re-transcribe the table here, and
keep _snapshot.is_current_release honest about what the numbers describe.
Results
Ratio is cds2 time divided by baseline time: 1.00x means parity with the underlying library. Rows above 1.00x are cases where cds2 was slower in this run.
| Benchmark | Baseline | Baseline (s) | cds2 (s) | cds2/baseline |
|---|---|---|---|---|
| solve 8x8 x300 | numpy | 0.001703 | 0.002000 | 1.17x |
| solve 800x800 | numpy | 0.011891 | 0.014525 | 1.22x |
| eigh 400x400 | numpy | 0.074720 | 0.070310 | 0.94x |
| rfft n=262144 | numpy | 0.004206 | 0.003277 | 0.78x |
| welch n=131072 | scipy | 0.027046 | 0.027981 | 1.03x |
| t-test n=100000 | scipy | 0.001268 | 0.001152 | 0.91x |
| describe n=500000 | scipy | 0.033102 | 0.033154 | 1.00x |
| minimize rosenbrock | scipy | 0.006049 | 0.004359 | 0.72x |
| mc-pi n=2000000 | numpy | 0.050287 | 0.034881 | 0.69x |
| dataframe summary 200000x5 | pandas | 0.055953 | 0.101789 | 1.82x |
| pagerank 400n/2400e | networkx | 0.003661 | 0.000559 | 0.15x |
| kmeans 4000x2 k=8 | sklearn | 0.016619 | 0.013880 | 0.84x |
| linreg 20000x10 | sklearn | 0.005879 | 0.005379 | 0.91x |
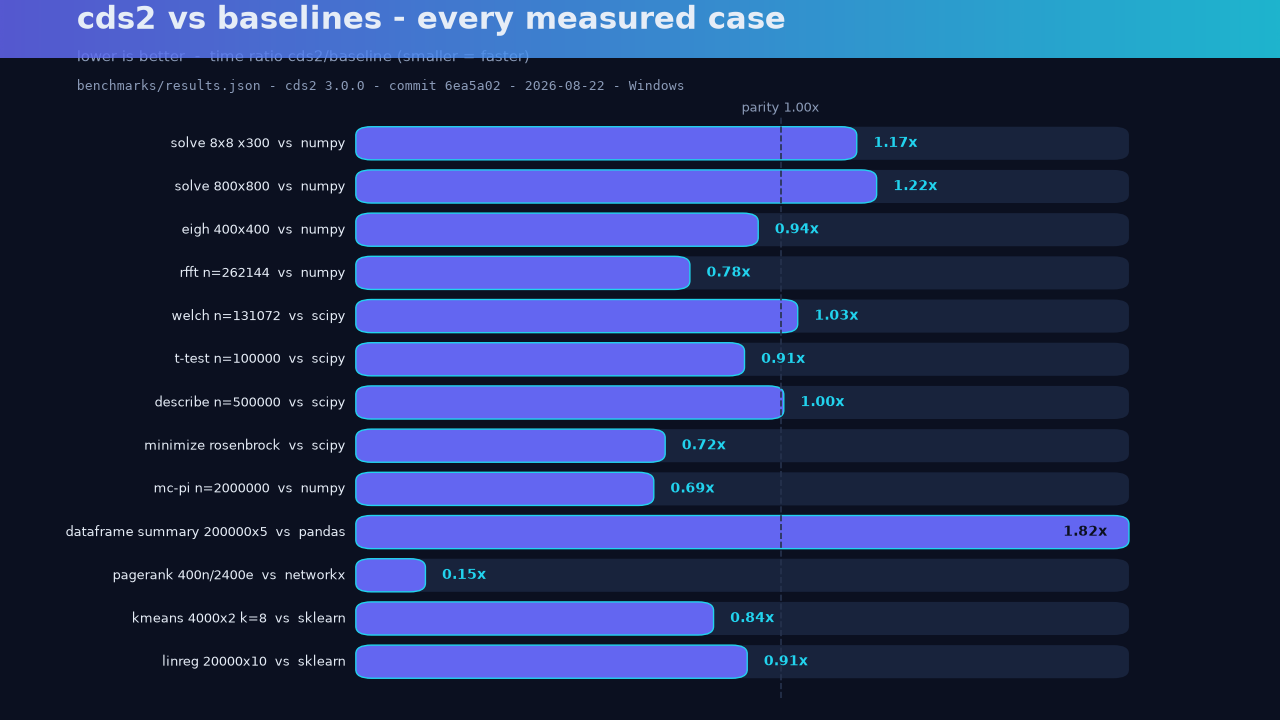
Figure: every row of benchmarks/results.json (cds2 3.0.0, 2026-08-22),
winners and losers. Generated by scripts/make_promo.py from the JSON file,
never hand-edited.
Wrapper-only rows (solve, fft, welch, t-test, minimize) demonstrate that the cds2 API layer adds no measurable cost over calling NumPy/SciPy directly. Rows where cds2 returns strictly more information (describe adds quartiles; dataframe summary adds nulls and uniques per column) carry a small honest premium for it. Specialist rows (NetworkX, scikit-learn) show where pure-NumPy implementations win or lose against compiled C code.